Headline Risk And Monthly Trading Models - Keeping Drawdowns In Check
Originally published in Seeking Alpha.
David Alan Carter
June 14, 2019 May 2019 was brutal not only for the overall market, but for many ETF rotation strategies that were caught flat-footed by headline news. Investors are understandably concerned at the prospects for these strategies – and their portfolios - going forward. Here are two simple things you can do to help protect portfolios against headline risk.
|
If you’re dutifully investing in the stock market via an ETF rotation strategy that rebalances monthly, you couldn’t help but notice that May was a tough month. Many if not most trend-following trading models were down, some significantly, as the S&P 500 sank 6% and the NASDAQ 100 (QQQ) plunged almost 10%.
What happened? Most such rotation strategies were sailing along the first of the month in risk-on mode, nothing but blue skies ahead, and were caught flat-footed on Sunday, May 5 by a tweet from the U.S. President escalating the trade war with China.
The media went to town, and traders went defensive. The market plunged nearly 500 points on Monday, recovered most of that, then down another 473 points the next day. And on and on. The market stayed defensive for the balance of the month, delivering the worst May in seven years and the second worst since 1960 with the S&P 500 wiping out $4 trillion.
Yes, we live in that kind of world now, when 280 characters in a social media message can dramatically move markets – for better or worse.
Beauty and the Beast
|
I thought this was a good time to remind us all that mechanical trading strategies that look so pleasant and profitable from a distance can be quite frightening up close. The better of such strategies identify ETF winners from small pools of candidates using momentum algorithms, moving average filters, or risk-parity techniques (or some combination thereof) to improve our odds ever so slightly that we'll beat the market in the coming month.
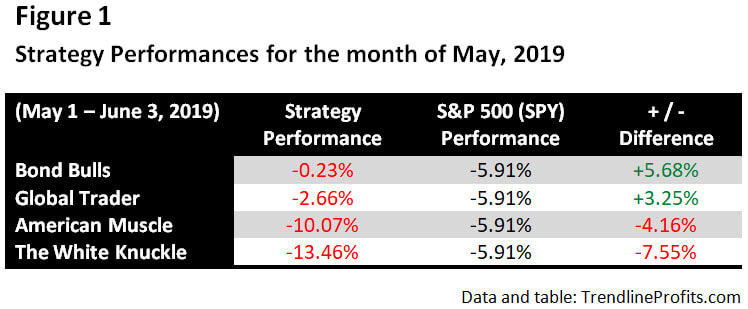
What none of the strategies can do, what no mechanical trading strategy can do, is fully prepare for the unexpected. Read: headline risk. A lot can happen in the 30 days between rebalancing. As a developer of multiple such models, I’ve seen firsthand the investor angst that can come from markets that turn on a dime from some news headline. I live it, myself. With the dust thankfully settled from May, let’s take a moment to see how we can help mitigate the downside risk in our portfolios even as we employ strategies that are designed in large part to mitigate those risks. In the interest of transparency, let me first line up each of the four subscription models I represent, along with their respective performances from May. Pretty ugly, I admit. Although two of the four models beat their benchmark, the S&P 500 index ETF (SPY) for the month; that would be Bond Bulls and Global Trader. I know, I know. Cue the old saw, “You can’t eat relative performance.”
Still, there’s a lesson floating around in there. Because - not coincidentally – the best performer of the bunch was a bond rotation model, and the second best employs funds outside the U.S. Which leads me to the following two points: |
1.
|
In general, the higher the anticipated returns of a particular trading model, the higher the risk metrics (volatility and max drawdown). I can almost guarantee you that a model trying to deliver a 40%, 30%, or even a 20% average annual return will in fact deliver quite a bit of pain along the way. It could very well reach those performance objectives in the end, but it might have lost you as an investor when one particular drawdown exceeded your pain threshold.
And that’s the real problem – drawdowns. A drawdown is a measurement of decline from peak to trough, before a new peak is attained. It can refer to an asset, fund or portfolio, and is usually expressed as a percentage from top to bottom. A maximum drawdown, as commonly associated with trading models, is the largest of such drawdowns measured between rebalancing periods over the life of the backtest history. That doesn’t mean things can’t get worse for the model. It just means they’ve been that bad in the past. Drawdowns are the biggest threats in investing for two reasons.
Everyone’s tolerance for risk is different. While some can handle a 20% drawdown, other will jump ship at 10%. Knowing your risk profile is critical. Sadly, sometimes you can’t know that profile until your portfolio is put to the test. In the meantime, while trying to figure that out, better to lean toward safety. So, if you’re betting the farm on a single strategy, make sure it’s not one of those moon shot models with big promises but equally big drawdowns. Because an abandoned strategy will get you nowhere. |
2.
|
A better bet: multiple trading models operating within your portfolio. When combining one or two low-risk models in conjunction with a non-correlated higher-risk model, the result is more likely to be a portfolio that will let you sleep peacefully at night.
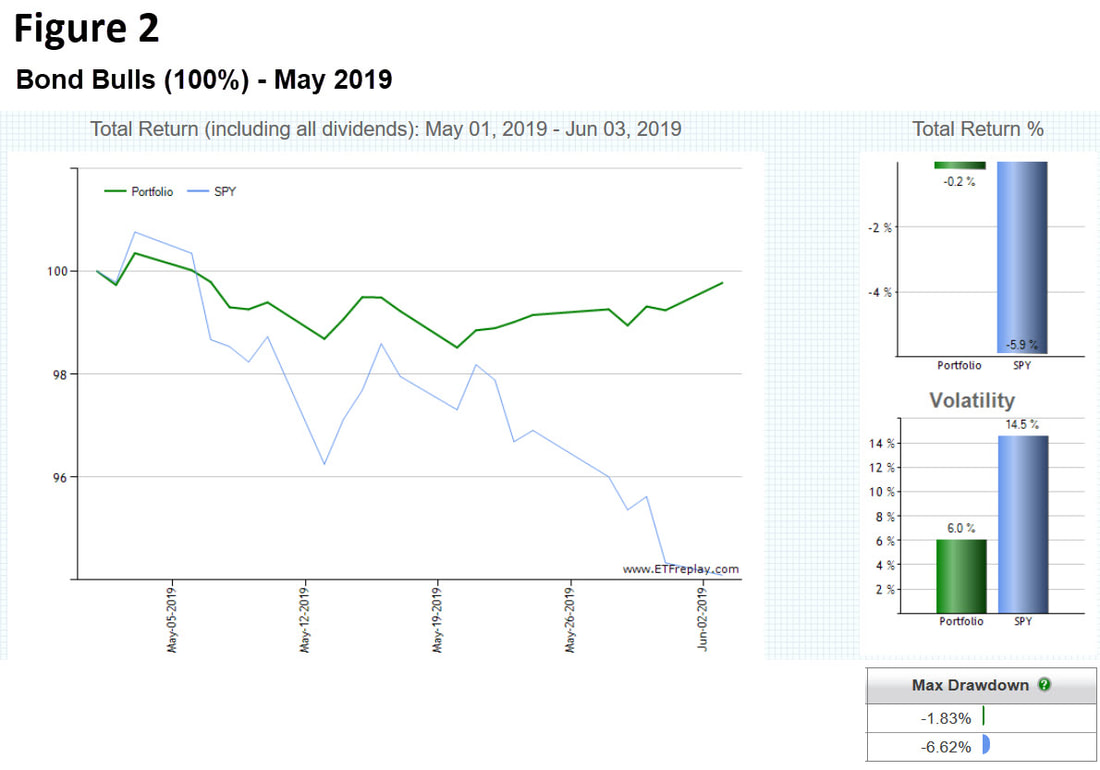
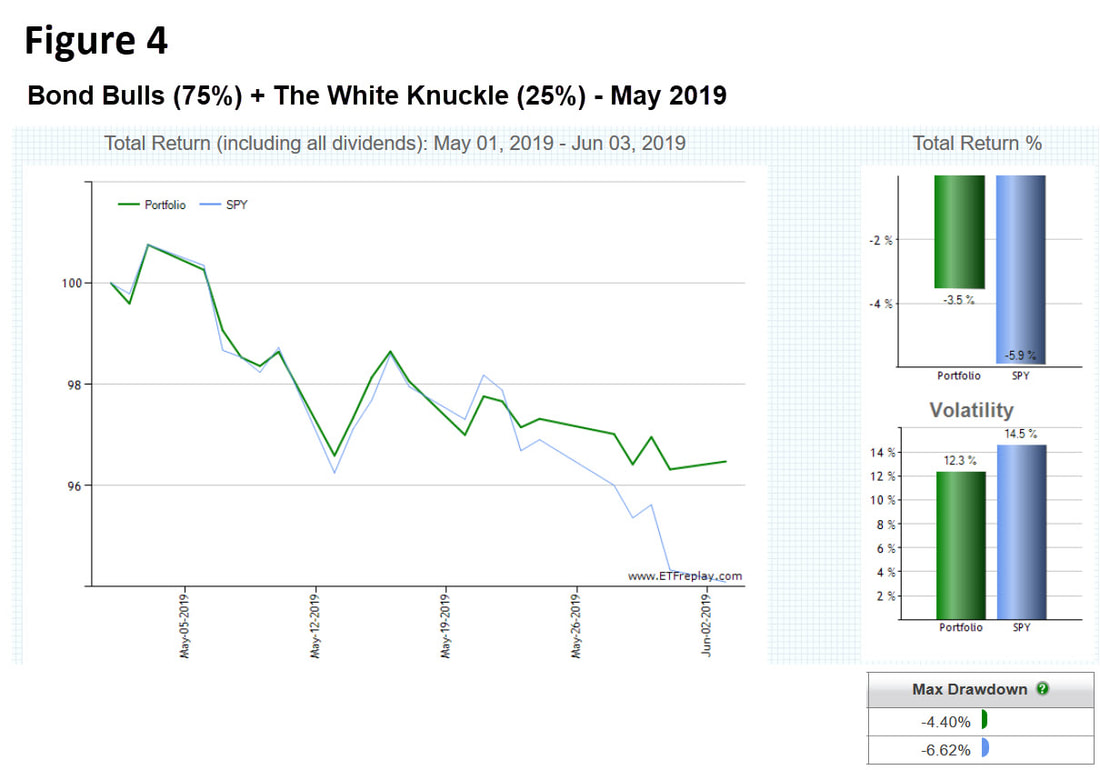
Here’s an example from my own lineup. While I normally recommend no more than a 15% allocation of the leveraged trading strategy The White Knuckle in any portfolio, some investors have let me know that they’re using it in combination with the bond rotation strategy Bond Bulls in a ratio of 75% Bond Bulls and 25% White Knuckle. Although my knee-jerk reaction was, “Whoa, that’s too much Knuckle,” here’s how the month of May shook out for these folks: total return of -3.54% vs. -5.91% for SPY. So this particular combination of strategies outperformed the benchmark by +2.37% for the month. Better yet, that very same combination has delivered an 18.6% CAGR over the past 8 years. And as evidenced by May’s performance, has done so with far less risk than holding the benchmark S&P 500 alone. [Separately, the Bond Bulls rotation strategy delivered a 10.1% CAGR from 2011 to 2018 with a -6.6% max drawdown. For the same time period, The White Knuckle delivered a 43.1% CAGR with a -18.2% max drawdown. A mix of the two using a 75/25 ratio, delivered an 18.6% CAGR, fully 6%/year above the benchmark SPY, with a max drawdown of -9.5% - less than half that of SPY. Backtested returns.] Let’s see how it looks in graphics. First, the very conservative bond rotation strategy Bond Bulls vs. SPY for May, 2019. In Figure 2, you can see Bond Bull’s loss of -0.2% vs. SPY at -5.9%. Volatility was less than half that of SPY, and max drawdown less than a third. Bond Bulls at the time was holding a mix of the following ETFs:
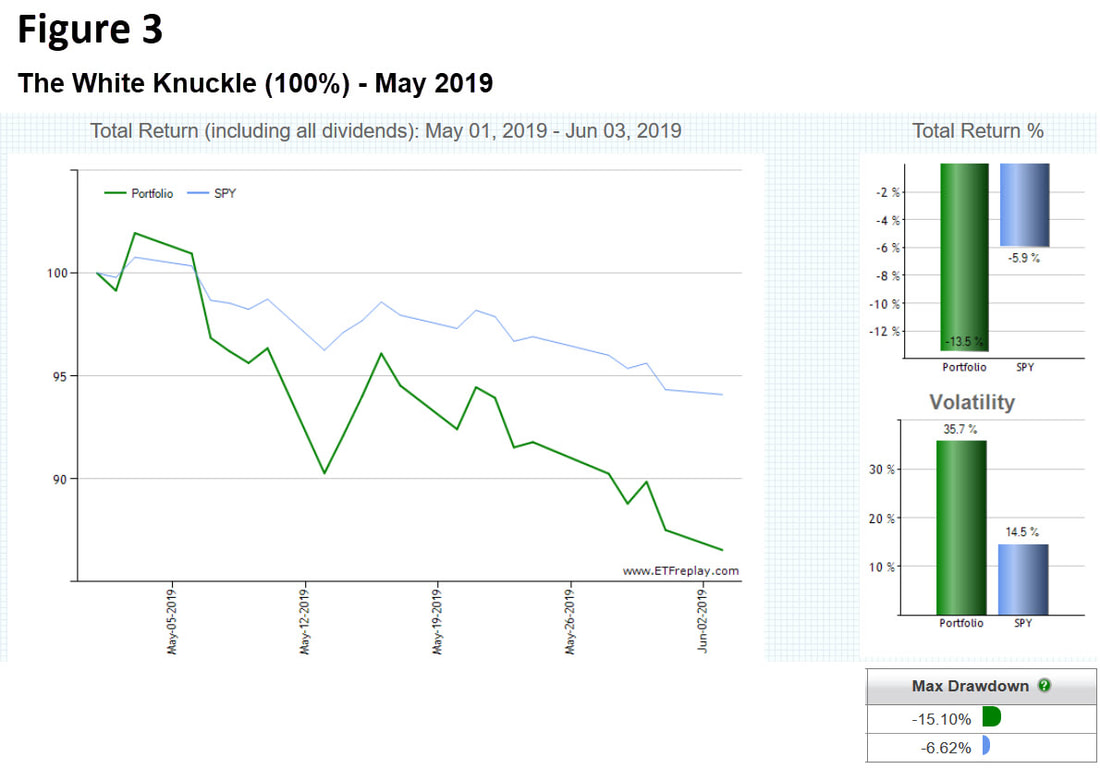
-- U.S. convertible securities (CWB) -- 20+ year U.S. Treasury Bonds (TLT) -- U.S. mortgage REITs (MORT) Next, the high-risk, high-return leveraged trading strategy The White Knuckle vs. SPY for May, 2019. Figure 3 demonstrates what can happen when a high-flying trading model meets ominous headlines between rebalancing. The White Knuckle at the time was holding the following ETFs in various proportions:
-- 3x leveraged exposure to the S&P 500 (SPXL) -- 3x leveraged exposure to 20+ year U.S. Treasury Bonds (TMF) -- 3x leveraged exposure to 100 of the largest firms listed on NASDAQ (TQQQ) Finally, we’ll see how a combination of the two strategies, in a 75/25 mix, played out for May. As you can see from Figure 4, this particular combination, overweight with a conservative bond rotation strategy, produced less volatility and a lighter drawdown than holding SPY alone. And while it also resulted in a loss for May, it wasn’t nearly as bad as the broader market.
Other legitimate trading models from other reputable investment sites should show similar benefits in combination. |
Conclusion
|
Multiple strategies at work in a portfolio, especially when those models tend toward an inverse relationship with each other or focus on different asset classes or market sectors, not only provides diversity but brings down volatility and max drawdown. Yes I know, it also brings down returns. But we all need to balance risk and returns so that we can 1) sleep at night, and 2) stay invested.
You may not be able to eat relative performance, but in situations like this, if relative performance keeps you in the game, you’ll live to eat another day. Best of luck, David Alan Carter |


