
|
Conservative vs. Aggressive Portfolios
David Alan Carter
November 1, 2020 [Updated January 2, 2024] Are you a conservative investor, or aggressive? In other words, how much risk are you willing to take in return for potentially higher returns?
|
It’s generally assumed that folks approaching retirement age become more risk-averse and therefore more conservative in their investment choices. When risk equals the prospect of losing money, or losing greater sums of money, it’s easy to see why this might be the case.
After all, at retirement age and beyond there are fewer years to make up for significant losses to one’s portfolio. A stock market crash that takes 20-40% off the top of one’s retirement-age portfolio could end up translating into a significant lifestyle reduction.
But risk aversion isn’t limited by age. Anyone at any age with money on the line could be hardwired to choose the preservation of capital over the potential for a higher-than-average return.
At the other end of the spectrum are the guns blazing, pedal to the metal investors who are seeking huge gains and willing to throw caution to the wind to get there.
In the lineup of strategies at Trendline Profits, there is a monthly trading model for investors at either end of the spectrum – and something for those in between. Because I’ve been fielding an unusual number of questions lately regarding the riskiness of the models, and how to go about combining models to achieve diversity, I thought it would be a good idea to put some thoughts down in a post.
The Models Ranked By Risk |
In the first place, it’s never a bad idea to be cautious. In this market especially, cash is the safe trade. As I’ve mentioned in recent newsletters, cash is - in fact - a position. It means you’re prepared to act when circumstances better align with your risk tolerance.
But on to the strategies. On the scale of risk, from lowest risk to highest, here's how I would rank the strategies. Note: This is based only on max drawdown - which can (and will) change over time. There are other risk metrics to consider as well (e.g. Sharpe ratios, volatility, etc.). But for this ranking, we'll stick with max drawdown. Also note: the strategies undergo periodic modifications. An ETF may be delisted by its provider and need to be replaced. A blend of funds may no longer provide the hedge they used to. I may see an opportunity to adjust the parameters to improve returns or lessen the risk of the strategy. The performance figures and commentary below reflect the most recent modifications. As of January 2, 2024, from lowest risk to highest...
|
A Brief Note About Each Strategy |
|
Combining Strategies to Achieve Your Target |
Note: Unless otherwise noted, the following examples reflect data from 2008 through 2023. They do not incorporate 2024 YTD.
I will update the data below, and the representative graphics, once we have the full year 2024 behind us (sometime in January 2025). --David While a single strategy like Bond Bulls or The 12% Solution might well satisfy the needs of the conservative investor, and both represent core strategies for that reason, a combination of strategies has the potential to achieve conservative risk targets – while providing increased diversity and the prospect of improved returns.
The Returns Calculator [available to subscribers] can be of help. For those with access to Excel spreadsheets, the calculator can be accessed via the blue “Download File” link on the page. Starting with Bond Bulls (a relatively low-risk model), a 100% allocation from 2008 to 2023 (last full year) looks like this: 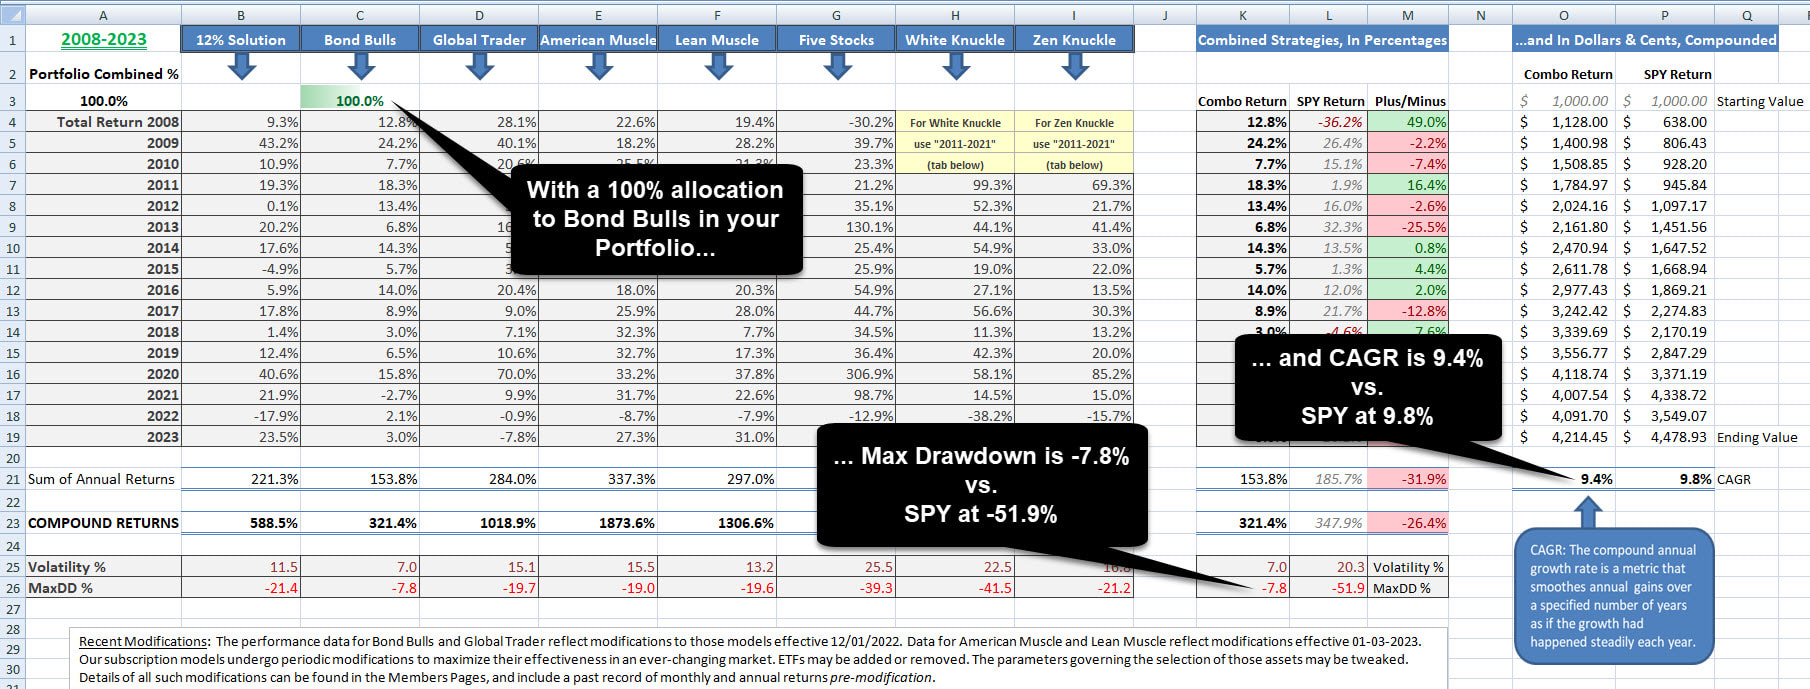
Click to enlarge.
With 100% Bond Bulls, we’ve been able to achieve an 9.4% CAGR with a max drawdown of only -7.8% over the course of 16 years. [As a side note, the calculations from this spreadsheet may not exactly match the figures on the Members Pages. They’re close, but not a mirror image. The difference being a matter of precision between the strategies’ algorithms vs. Excel spreadsheet formulas.]
Let’s experiment a bit, and bring in American Muscle for a good dose of U.S. powerhouse equities. Let’s go with a 60/40 mix of the two. We’re still overweight Bond Bulls. Here’s what that looks like: 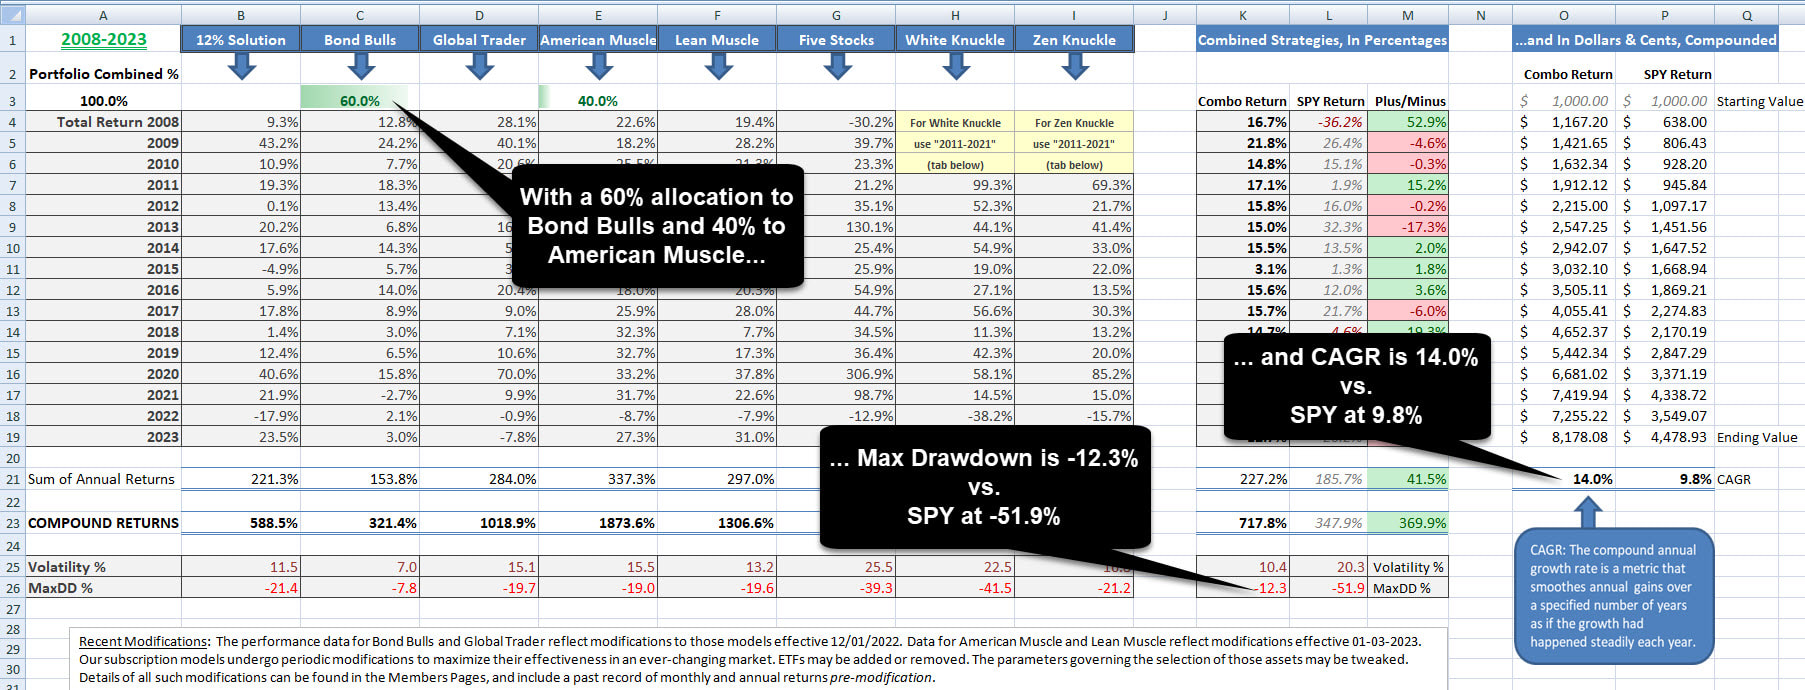
Click to enlarge.
Notice that we’ve increased our CAGR from 9.4% to 14.0%, although by doing so we increased our max drawdown by 4.5%.
Let’s experiment a bit further and bring in Global Trader for some international exposure. Let’s go with a 60/20/20 mix of the three. We’re still overweight Bond Bulls. Here’s what that looks like: 
Click to enlarge.
OK, we've taken CAGR down a bit from the previous chart to 13.3% (reduced by 0.7%) and max drawdown actually bumped up a fraction. Given that we’ve added some valuable international diversity, one could argue that we've strengthened the portfolio. Judgement call as to whether it was worth it. In any event, max drawdown continues to remain considerably less than that of SPY for the same time period (at -51.9%).
Next, let’s change things up a bit and reduce our allocation to Bond Bulls. Let's go with a 40/30/30 mix of the same three strategies. Here’s what that looks like: 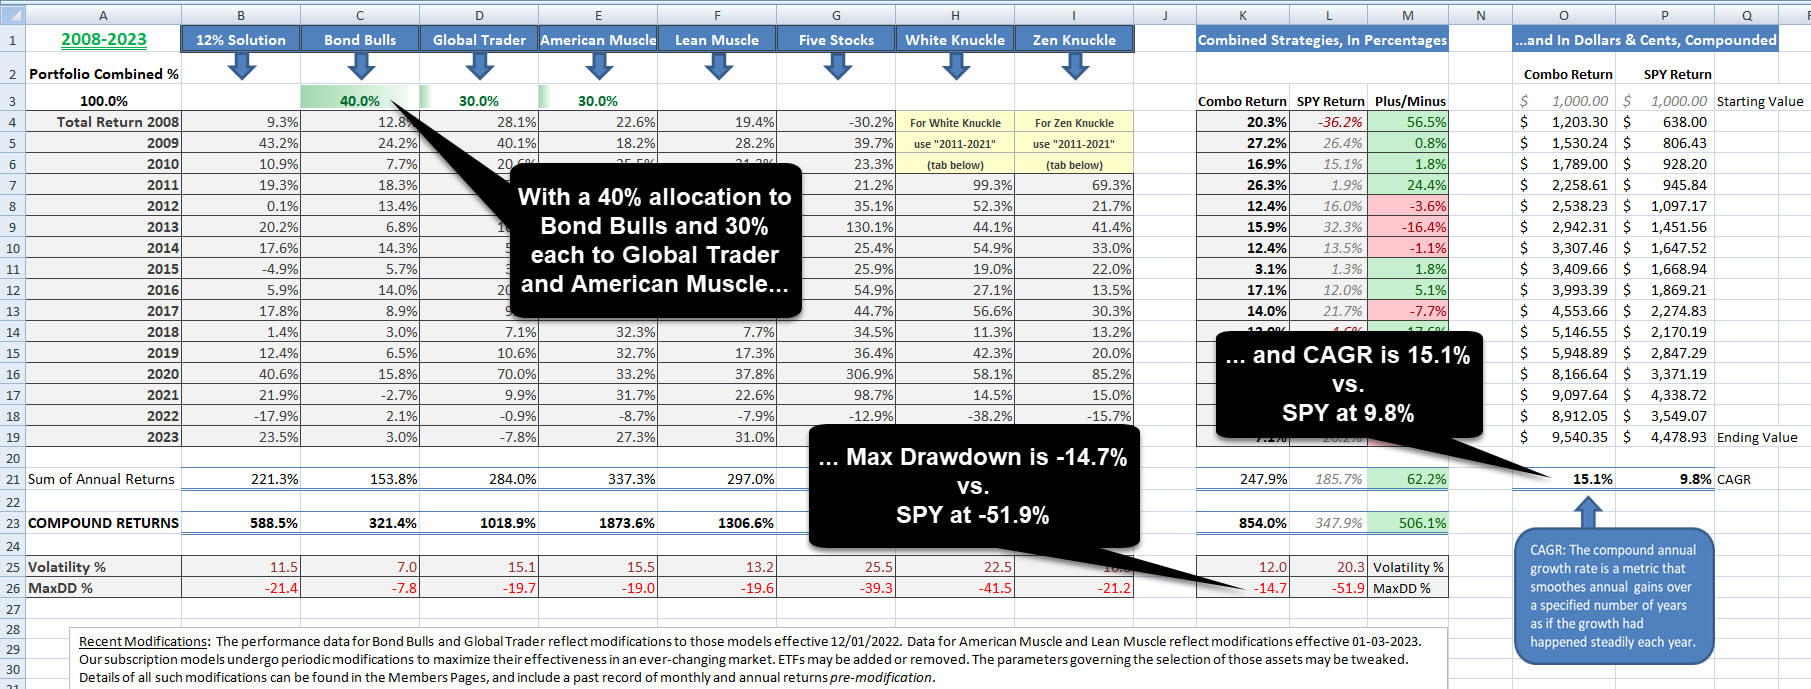
Click to enlarge.
In this example, we’ve boosted CAGR to 15.1% at a “cost” of an additional 2.3% in max drawdown.
Now, there are a near infinite number of combinations you can play with. Change the percentage allocations further. Bring the mother strategy (The 12% Solution) into the mix. And if you go to the second sheet (the second tab at the bottom left of the spreadsheet), you can invite The White Knuckle (and Zen Knuckle) to the party.
Additional sheets (tabs) allow you to see the performances of various combinations for shorter time frames. 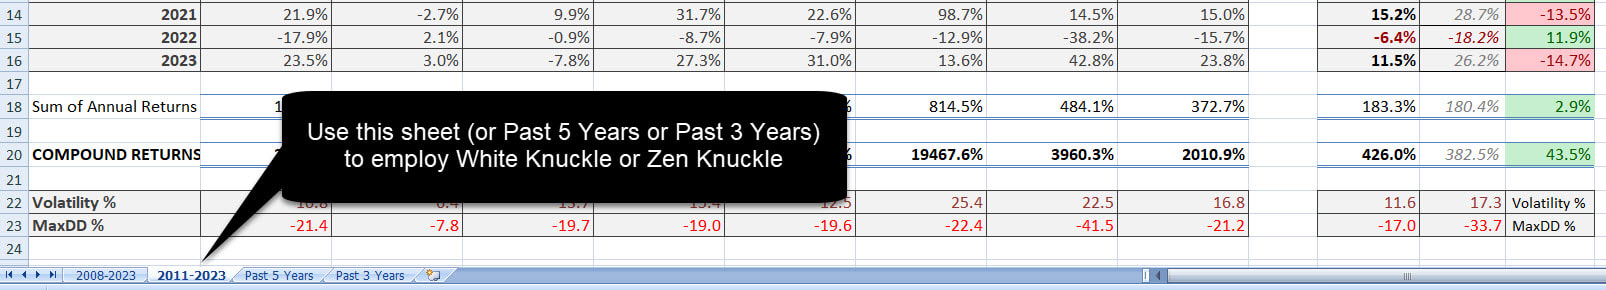
Click to enlarge.
|
Edging Up The Aggressive |
The above examples were structured to have some appeal to conservative to moderate investors. For aggressive investors, the same concepts apply, only you might be using different strategies and proportions thereof.
Instead of 40/30/30 Bond Bulls to Global Trader to American Muscle, you might be flipping that on it's head. In fact, let's do just that: let's flip the tables and reduce Bond Bulls to 30% of our portfolio while leaving Global Trader at 30% and boosting American Muscle to 40%. With this experiment, we're gently tipping the scales toward a more aggressive portfolio. Here's what that looks like: 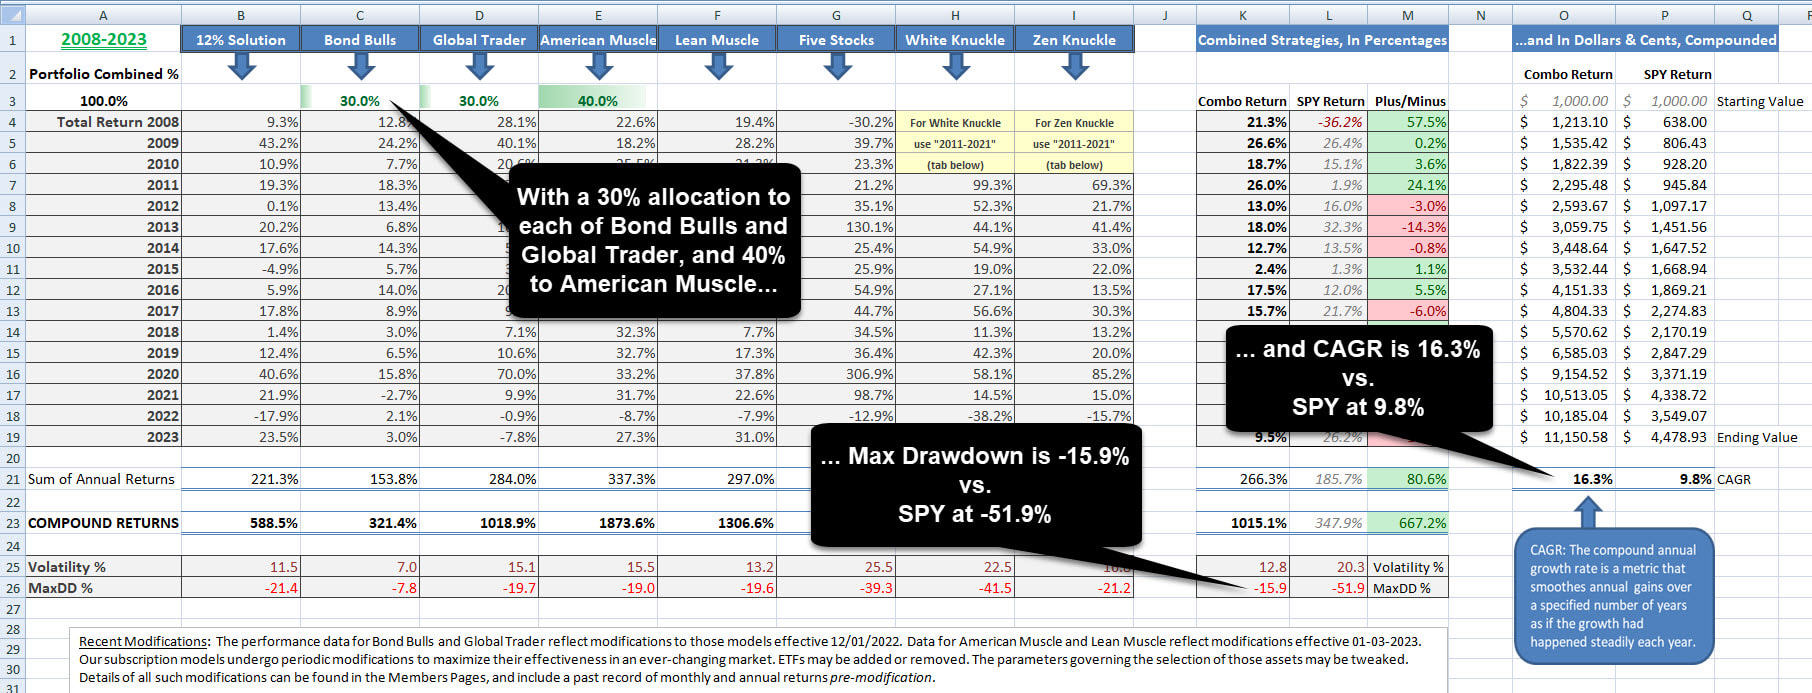
Click to enlarge.
In this exercise, we’ve boosted CAGR to 16.3% but at the “cost” of a near -16% max drawdown. Yes, those returns are sweet. But at this risk level, one thing is certain: this combination of strategies would have kept your attention during past market corrections. For some investors, that level of risk might be too much. For others, no problem.
For those in the latter camp, The White Knuckle strategy will likely hold some interest. Just keep in mind my cautionary note on that strategy – no more than 5% - 10% - 15% or so of your portfolio, depending on your tolerance for risk. This goes for the Zen Knuckle, as well.
[SIDEBAR: It should go without saying, but I'll say it anyway. If employing a combination of White Knuckle and Zen Knuckle, keep the combination to 5% - 10% - 15% or so, in total.] Further regarding The White Knuckle: a combination that only incorporates American Muscle and The White Knuckle is not diversified – and extremely risky. If you’re going to use one of the Knuckles, better to pair it with Bond Bulls and/or Global Trader and/or The 12% Solution or such. Let's look at two final charts. We'll click on the 2011-2023 tab in the lower left margin of the spreadsheet. Now we can access the Knuckles. But before we do, let's see how our 30/30/40 portfolio (Bond Bulls, Global Trader, American Muscle) would have performed during this particular time frame. Here's how that looks. 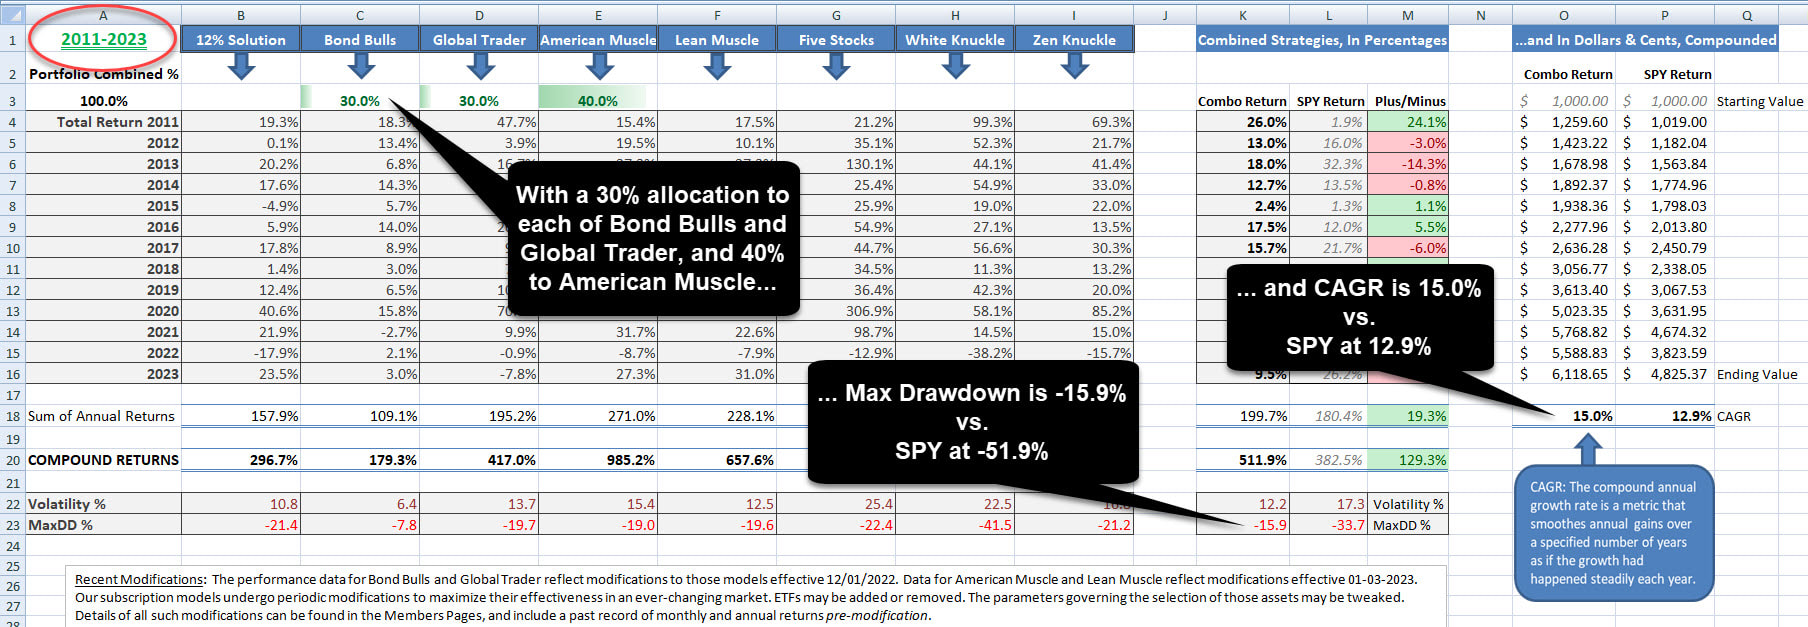
Click to enlarge.
You'll notice CAGR is down a bit from the prior chart. We're calculating with different years, so the returns are going to be different.
Now let's bring Zen Knuckle into the mix. We'll go with 30/30/30/10 - Bond Bulls, Global Trader, American Muscle and Zen Knuckle. So we've taken 10% away from American Muscle and put that percentage on Zen. Here's how that looks... 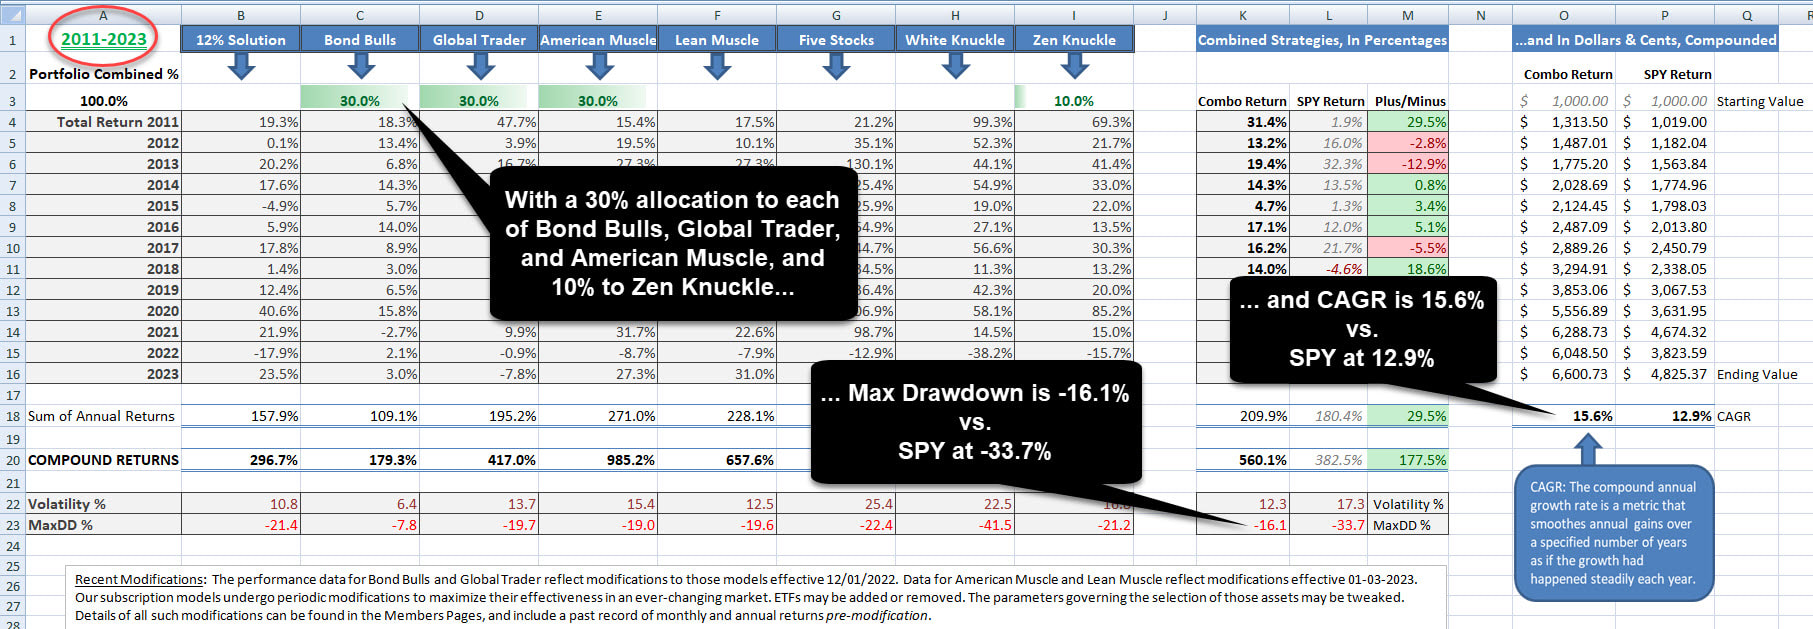
Click to enlarge.
In this final example, and during this time frame, we've boosted our average annual return by 0.6% (to 15.6% CAGR) while increasing our max drawdown only a fraction (0.2%).
Keep in mind that when employing either of the Knuckle strategies, we can only backtest through 2011, so the Great Recession of 2008 is not represented. This explains why SPY's CAGR is higher than on previous charts, and the max drawdown is "only" -33.7%, considerably less than the -51.9% when the Great Recession is factored in. [SIDEBAR: The new Five Stocks was introduced in April 2023, and while it is incorporated into the Returns Calculator, it is not reflected in any of the example combinations above. One year in particular - 2020 - saw outsized gains that tend to skew returns for combinations. When experimenting with your own combinations, don't go crazy with Five Stocks. I would advise keeping an allocation to 5% or so to begin with. You can always increase that in the future once you're comfortable with the model.] |
Allocation Calculator |
If you do end up employing a combination of strategies, by all means check out the Allocation Calculator [available to subscribers] to make your life easier on rebalancing day.
|
One Final Note Regarding Drawdowns |
The max drawdowns cited in this article and everywhere on the website are historical points of reference. They are the maximum drawdowns the strategies have experienced over the time frames cited. They are not floors, they are not safety nets. In fact, the actual largest drawdown for each and every one of the strategies is lurking out there in the future.
Keep that in mind when planning. Best of luck, David |